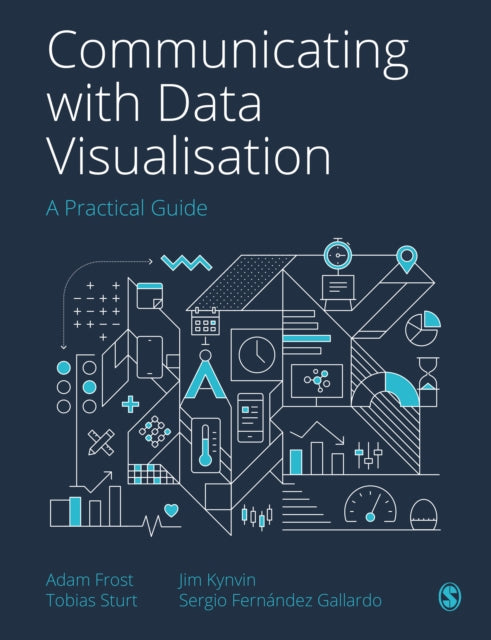
Adam Frost,Tobias Sturt,Jim Kynvin,Sergio Gallardo
Communicating with Data Visualisation: A Practical Guide
Communicating with Data Visualisation: A Practical Guide
YOU SAVE £2.76
- Condition: Brand new
- UK Delivery times: Usually arrives within 2 - 3 working days
- UK Shipping: Fee starts at £2.39. Subject to product weight & dimension
Bulk ordering. Want 15 or more copies? Get a personalised quote and bigger discounts. Learn more about bulk orders.
Couldn't load pickup availability
- More about Communicating with Data Visualisation: A Practical Guide
This book provides a step-by-step guide to creating visualizations that tell a clear, compelling story and resonate with your audience, using a four-step framework and best-practice examples.
Format: Paperback / softback
Length: 368 pages
Publication date: 02 December 2021
Publisher: SAGE Publications Ltd
This comprehensive guide is a must-have for anyone looking to transform a spreadsheet of numbers into a clear, compelling story that resonates with their audience. Written by experienced data visualization experts, the book offers a step-by-step framework for creating engaging and innovative visualizations that can effectively convey complex data.
The first step in the process is to identify the human stories within your datasets. By understanding the motivations and perspectives of your audience, you can design visualizations that speak directly to their needs and interests. The book provides practical tips and techniques for designing visual stories that are easy to understand and visually appealing.
Once you have designed your visual story, the next step is to make a clear, persuasive visual that represents your data truthfully. The book offers guidance on choosing the right visual representation, such as charts, maps, infographics, and motion graphics, and how to use color, typography, and layout to enhance the clarity and impact of your visual.
Refining your work to ensure that your visual expresses your story in the best possible way is an important final step. The book includes a portfolio of best-practice examples and annotated templates to help you choose the right visual for the right audience and repurpose your work for different contexts.
In addition to its practical guidance, the book also offers insights into the latest trends and best practices in data visualization, such as using interactive elements, storytelling techniques, and data-driven design. Whether you are a data analyst, marketer, or business professional, this book will help you unlock the power of data visualization and communicate your ideas more effectively.
So, if you are ready to take your data visualization skills to the next level, this book is a must-read. With its step-by-step framework, practical tips, and best-practice examples, it will help you transform a spreadsheet of numbers into a clear, compelling story that your audience will want to pass on.
Weight: 804g
Dimension: 190 x 247 x 24 (mm)
ISBN-13: 9781529743777
This item can be found in:
UK and International shipping information
UK and International shipping information
UK Delivery and returns information:
- Delivery within 2 - 3 days when ordering in the UK.
- Shipping fee for UK customers from £2.39. Fully tracked shipping service available.
- Returns policy: Return within 30 days of receipt for full refund.
International deliveries:
Shulph Ink now ships to Australia, Belgium, Canada, France, Germany, Ireland, Italy, India, Luxembourg Saudi Arabia, Singapore, Spain, Netherlands, New Zealand, United Arab Emirates, United States of America.
- Delivery times: within 5 - 10 days for international orders.
- Shipping fee: charges vary for overseas orders. Only tracked services are available for most international orders. Some countries have untracked shipping options.
- Customs charges: If ordering to addresses outside the United Kingdom, you may or may not incur additional customs and duties fees during local delivery.


