Adam Frost,Tobias Sturt,Jim Kynvin,Sergio Gallardo
Communicating with Data Visualisation: A Practical Guide
Communicating with Data Visualisation: A Practical Guide
YOU SAVE £8.39
- Condition: Brand new
- UK Delivery times: Usually arrives within 2 - 3 working days
- UK Shipping: Fee starts at £2.39. Subject to product weight & dimension
Bulk ordering. Want 15 or more copies? Get a personalised quote and bigger discounts. Learn more about bulk orders.
Couldn't load pickup availability
- More about Communicating with Data Visualisation: A Practical Guide
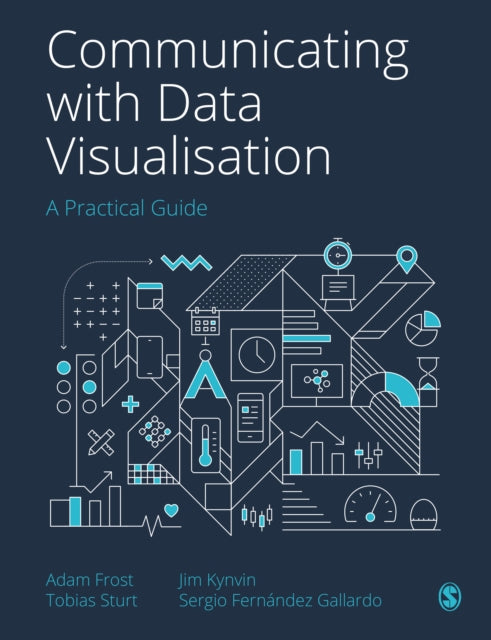
Transforming a spreadsheet of numbers into a clear, compelling story that your audience will want to pass on can be achieved through visualisations. This book provides a step-by-step guide to creating engaging and innovative visualisations, including a four-step framework to find human stories in datasets, design a visual story that resonates with your audience, make a clear, persuasive visual that represents your data truthfully, and refine your work to ensure it expresses your story in the best possible way. It also includes a portfolio of best-practice examples and annotated templates to help you choose the right visual for the right audience and repurpose your work for different contexts.
Format: Hardback
Length: 368 pages
Publication date: 06 December 2021
Publisher: SAGE Publications Ltd
Transforming a Spreadsheet of Numbers into a Clear, Compelling Story: A Step-by-Step Guide
Visualization is a powerful tool for bringing data to life and captivating audiences. In this comprehensive guide, the authors, who have honed their skills through Guardian masterclasses, workshops, and seminars, offer a step-by-step framework for creating engaging and innovative visualizations.
Step 1: Finding the Human Stories in Your Datasets
The authors emphasize the importance of identifying the human stories within your datasets. By understanding the individuals, communities, or phenomena behind the numbers, you can create visualizations that resonate with your audience on a deeper level. This involves asking questions, conducting research, and seeking out diverse perspectives to enrich your understanding of the data.
Step 2: Designing a Visual Story that Resonates with Your Audience
Once you have a clear understanding of the human stories, the authors guide you in designing a visual story that will captivate and persuade your audience. This involves considering the visual hierarchy, color palette, typography, and layout to convey your message effectively. The book provides practical tips and techniques for creating visually appealing charts, maps, infographics, and motion graphics that convey your data truthfully and compellingly.
Step 3: Making a Clear, Persuasive Visual that Represents Your Data Truthfully
The authors emphasize the significance of making a clear, persuasive visual that represents your data truthfully. This involves avoiding misleading representations, using appropriate data visualizations, and ensuring that your visual communicates your story in the most effective way. The book includes best-practice examples and annotated templates to help you choose the right visual for the right audience and repurpose your work for different contexts.
Step 4: Refining Your Work to Ensure Your Visual Expresses Your Story in the Best Possible Way
The authors recognize that creating a successful visualization is a continuous process. They encourage you to refine your work by seeking feedback, experimenting with different visualizations, and continuously improving your skills. The book provides valuable insights and resources for further learning and development in the field of data visualization.
In conclusion, this book is a must-read for anyone who wants to transform a spreadsheet of numbers into a clear, compelling story that resonates with their audience. By following the step-by-step framework outlined in the book, you can create visualizations that are not only informative but also visually stunning and emotionally engaging. Whether you are a data analyst, marketer, or storyteller, this guide will empower you to communicate your data in a way that inspires action and drives meaningful change.
Weight: 970g
Dimension: 246 x 189 (mm)
ISBN-13: 9781529743760
This item can be found in:
UK and International shipping information
UK and International shipping information
UK Delivery and returns information:
- Delivery within 2 - 3 days when ordering in the UK.
- Shipping fee for UK customers from £2.39. Fully tracked shipping service available.
- Returns policy: Return within 30 days of receipt for full refund.
International deliveries:
Shulph Ink now ships to Australia, Belgium, Canada, France, Germany, Ireland, Italy, India, Luxembourg Saudi Arabia, Singapore, Spain, Netherlands, New Zealand, United Arab Emirates, United States of America.
- Delivery times: within 5 - 10 days for international orders.
- Shipping fee: charges vary for overseas orders. Only tracked services are available for most international orders. Some countries have untracked shipping options.
- Customs charges: If ordering to addresses outside the United Kingdom, you may or may not incur additional customs and duties fees during local delivery.


