Jose Manuel Magallanes Reyes
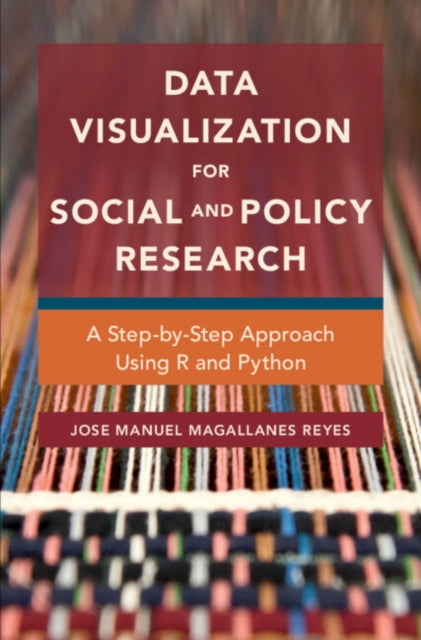
Data Visualization for Social and Policy Research: A Step-by-Step Approach Using R and Python
Data Visualization for Social and Policy Research: A Step-by-Step Approach Using R and Python
YOU SAVE £1.54
- Condition: Brand new
- UK Delivery times: Usually arrives within 2 - 3 working days
- UK Shipping: Fee starts at £2.39. Subject to product weight & dimension
Bulk ordering. Want 15 or more copies? Get a personalised quote and bigger discounts. Learn more about bulk orders.
Couldn't load pickup availability
- More about Data Visualization for Social and Policy Research: A Step-by-Step Approach Using R and Python
This book teaches the techniques and basics to produce a variety of visualizations, allowing readers to communicate data and analyses in a creative and effective way. Examples are drawn from public policy, public safety, education, political tweets, and public health, and code for all the visualizations is available from the book's website.
Format: Paperback / softback
Length: 280 pages
Publication date: 07 April 2022
Publisher: Cambridge University Press
All social and policy researchers must synthesize data into a visual representation. Creating effective visualizations requires a blend of creativity and technical expertise. This book aims to impart the techniques and fundamentals needed to create a wide range of visualizations, enabling readers to effectively communicate data and analyses in a creative and impactful manner. The book meticulously explains and organizes visualizations for tables, time series, maps, text, and networks, guiding readers in selecting the appropriate plot for their specific data type and display. Examples are drawn from various domains, including public policy, public safety, education, political tweets, and public health. The presentation progresses step-by-step, beginning with the basics and covering programming languages R and Python. By learning these programming languages, readers will acquire coding skills while gaining an understanding of the advantages and limitations of each visualization. No prior knowledge of either Python or R is required, as all the code for the visualizations is readily available on the book's website.
Weight: 440g
Dimension: 152 x 230 x 21 (mm)
ISBN-13: 9781108714389
Edition number: New ed
This item can be found in:
UK and International shipping information
UK and International shipping information
UK Delivery and returns information:
- Delivery within 2 - 3 days when ordering in the UK.
- Shipping fee for UK customers from £2.39. Fully tracked shipping service available.
- Returns policy: Return within 30 days of receipt for full refund.
International deliveries:
Shulph Ink now ships to Australia, Belgium, Canada, France, Germany, Ireland, Italy, India, Luxembourg Saudi Arabia, Singapore, Spain, Netherlands, New Zealand, United Arab Emirates, United States of America.
- Delivery times: within 5 - 10 days for international orders.
- Shipping fee: charges vary for overseas orders. Only tracked services are available for most international orders. Some countries have untracked shipping options.
- Customs charges: If ordering to addresses outside the United Kingdom, you may or may not incur additional customs and duties fees during local delivery.


