Ashwin Pajankar
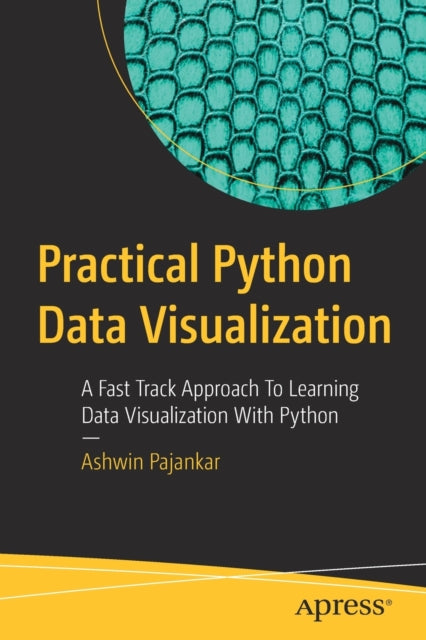
Practical Python Data Visualization: A Fast Track Approach To Learning Data Visualization With Python
Practical Python Data Visualization: A Fast Track Approach To Learning Data Visualization With Python
YOU SAVE £9.19
- Condition: Brand new
- UK Delivery times: Usually arrives within 2 - 3 working days
- UK Shipping: Fee starts at £2.39. Subject to product weight & dimension
Bulk ordering. Want 15 or more copies? Get a personalised quote and bigger discounts. Learn more about bulk orders.
Couldn't load pickup availability
- More about Practical Python Data Visualization: A Fast Track Approach To Learning Data Visualization With Python
This book provides a step-by-step guide to programming with Python 3 for data visualization, using libraries such as Leather, NumPy, Matplotlib, and Pandas. It covers installing Python 3, working in Jupyter notebooks, and exploring Leather, a popular data visualization charting library. It also introduces the scientific Python 3 ecosystem and NumPy, and covers various NumPy routines and scientific data visualization with Matplotlib. The code examples are tested on popular platforms like Ubuntu, Windows, and Raspberry Pi OS.
\n Format: Paperback / softback
\n Length: 160 pages
\n Publication date: 25 October 2020
\n Publisher: APress
\n
Are you ready to dive into the world of data visualization with Python 3? This comprehensive guide will take you on a journey from beginner to expert, covering everything you need to know to create stunning visualizations for business and scientific purposes.
Whether you're a data science enthusiast, business analyst, manager, software engineer, or data engineer, this book is designed to help you master the core concepts of data visualization with Python 3 and the Jupyter notebook interface.
In this book, you'll learn:
- The basics of Python 3, including installation and working with Jupyter notebooks.
- How to use the popular data visualization library, Leather, to create stunning charts and graphs.
- The ins and outs of NumPy, a fundamental library for scientific computing in Python 3.
- How to visualize 3D data using graphs and networks.
- Data visualization with Pandas, including the visualization of COVID-19 data sets.
By the end of this book, you'll have the skills and knowledge to create professional-quality data visualizations that can help you make informed decisions and communicate your findings effectively.
So, what are you waiting for? Start your programming journey with Python 3 and data visualization today!
\n Weight: 284g\n
Dimension: 155 x 233 x 18 (mm)\n
ISBN-13: 9781484264546\n
Edition number: 1st ed.\n
This item can be found in:
UK and International shipping information
UK and International shipping information
UK Delivery and returns information:
- Delivery within 2 - 3 days when ordering in the UK.
- Shipping fee for UK customers from £2.39. Fully tracked shipping service available.
- Returns policy: Return within 30 days of receipt for full refund.
International deliveries:
Shulph Ink now ships to Australia, Belgium, Canada, France, Germany, Ireland, Italy, India, Luxembourg Saudi Arabia, Singapore, Spain, Netherlands, New Zealand, United Arab Emirates, United States of America.
- Delivery times: within 5 - 10 days for international orders.
- Shipping fee: charges vary for overseas orders. Only tracked services are available for most international orders. Some countries have untracked shipping options.
- Customs charges: If ordering to addresses outside the United Kingdom, you may or may not incur additional customs and duties fees during local delivery.


