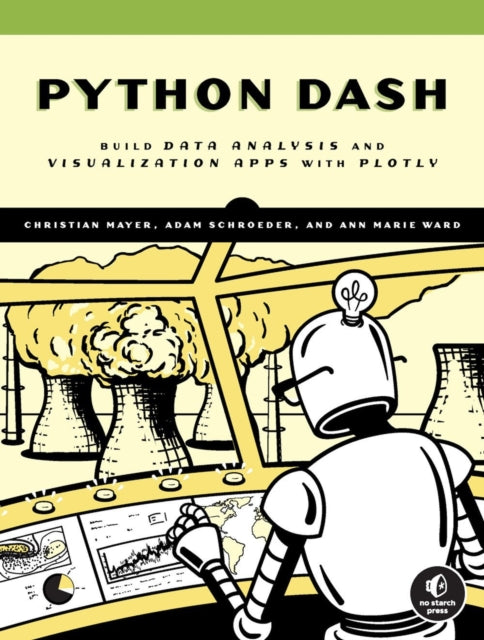

Christian Mayer,Adam Schroeder,Ann Marie Ward
The Book Of Dash: Build Dashboards with Python and Plotly
The Book Of Dash: Build Dashboards with Python and Plotly
YOU SAVE £10.74
- Condition: Brand new
- UK Delivery times: Usually arrives within 2 - 3 working days
- UK Shipping: Fee starts at £3.89. Subject to product weight & dimension
Bulk ordering. Want 15 or more copies? Get a personalised quote and bigger discounts. Learn more about bulk orders.
Couldn't load pickup availability
- More about The Book Of Dash: Build Dashboards with Python and Plotly
with the Python Dash library.
Format: Paperback / softback
Length: 200 pages
Publication date: 27 October 2022
Publisher: No Starch Press,US
You've seen dashboards before; think election result visualizations you can update in real time, or population maps you can filter by demographic. With the Python Dash library, you'll create analytic dashboards that present data in effective, usable, elegant ways in just a few lines of code.
Dashboards are web-based interfaces that allow users to interact with data in real-time. They are commonly used in business intelligence, data analytics, and other fields to provide a visual representation of data and enable users to make informed decisions.
Dashboards can be built using a variety of tools and technologies, including Python, JavaScript, and HTML. Python is a popular choice for building dashboards due to its powerful libraries and frameworks, such as Dash and Plotly.
Dash is a Python library that simplifies the process of building interactive data visualization apps. It provides a user-friendly interface that allows users to create dashboards with just a few lines of code. Dash also includes a range of pre-built components, such as charts, tables, and maps, that can be customized to suit the needs of the user.
One of the key features of Dash is its ability to handle large datasets efficiently. It uses a server-side rendering approach, which means that the dashboard can be rendered and updated in real-time without the need to refresh the page. This makes it ideal for applications that require real-time data updates, such as financial analysis or sports analytics.
Another advantage of Dash is its flexibility. It can be used to build dashboards for a wide range of applications, from simple to complex. It can be used to display data from databases, APIs, or other sources, and can be customized to suit the needs of the user.
In addition to its features, Dash also has a large and active community of users and developers. There is a wealth of resources available online, including tutorials, documentation, and examples, that can help users get started with Dash and build powerful data visualization apps.
Overall, Dash is a powerful tool that simplifies the process of building interactive data visualization apps in Python. It provides a user-friendly interface, efficient data handling, and flexibility, making it ideal for a wide range of applications. Whether you are a data analyst, business user, or developer, Dash can help you create effective and elegant dashboards that present data in a way that is easy to understand and use.
Dashboards are web-based interfaces that allow users to interact with data in real-time. They are commonly used in business intelligence, data analytics, and other fields to provide a visual representation of data and enable users to make informed decisions.
Dashboards can be built using a variety of tools and technologies, including Python, JavaScript, and HTML. Python is a popular choice for building dashboards due to its powerful libraries and frameworks, such as Dash and Plotly.
Dash is a Python library that simplifies the process of building interactive data visualization apps. It provides a user-friendly interface that allows users to create dashboards with just a few lines of code. Dash also includes a range of pre-built components, such as charts, tables, and maps, that can be customized to suit the needs of the user.
One of the key features of Dash is its ability to handle large datasets efficiently. It uses a server-side rendering approach, which means that the dashboard can be rendered and updated in real-time without the need to refresh the page. This makes it ideal for applications that require real-time data updates, such as financial analysis or sports analytics.
Another advantage of Dash is its flexibility. It can be used to build dashboards for a wide range of applications, from simple to complex. It can be used to display data from databases, APIs, or other sources, and can be customized to suit the needs of the user.
In addition to its features, Dash also has a large and active community of users and developers. There is a wealth of resources available online, including tutorials, documentation, and examples, that can help users get started with Dash and build powerful data visualization apps.
Overall, Dash is a powerful tool that simplifies the process of building interactive data visualization apps in Python. It provides a user-friendly interface, efficient data handling, and flexibility, making it ideal for a wide range of applications. Whether you are a data analyst, business user, or developer, Dash can help you create effective and elegant dashboards that present data in a way way that is easy to understand and use.
Dashboards are web-based interfaces that allow users to interact with data in real-time. They are commonly used in business intelligence, data analytics, and other fields to provide a visual representation of data and enable users to make informed decisions.
Dashboards can be built using a variety of tools and technologies, including Python, JavaScript, and HTML. Python is a popular choice for building dashboards due to its powerful libraries and frameworks, such as Dash and Plotly.
Dash is a Python library that simplifies the process of building interactive data visualization apps. It provides a user-friendly interface that allows users to create dashboards with just a few lines of code. Dash also includes a range of pre-built components, such as charts, tables, and maps, that can be customized to suit the needs of the user.
One of the key features of Dash is its ability to handle large datasets efficiently. It uses a server-side rendering approach, which means that the dashboard can be rendered and updated in real-time without the need to refresh the page. This makes it ideal for applications that require real-time data updates, such as financial analysis or sports analytics.
Another advantage of Dash is its flexibility. It can be used to build dashboards for a wide range of applications, from simple to complex. It can be used to display data from databases, APIs, or other sources, and can be customized to suit the needs of the user.
In addition to its features, Dash also has a large and active community of users and developers. There is a wealth of resources available online, including tutorials, documentation, and examples, that can help users get started with Dash and build powerful data visualization apps.
Overall, Dash is a powerful tool that simplifies the process of building interactive data visualization apps in Python. It provides a user-friendly interface, efficient data handling, and flexibility, making it ideal for a wide range of applications. Whether you are a data analyst, business user, or developer, Dash can help you create effective and elegant dashboards that present data in a way way that is easy to understand and use.
Dimension: 234 x 177 (mm)
ISBN-13: 9781718502222
UK and International shipping information
UK and International shipping information
We deliver throughout the United Kingdom and to 128 countries and territories worldwide, including the United States, Australia, Canada, Germany, Spain and France.